Platform Features
DEX MarketCap offers a comprehensive suite of analytics tools designed to provide traders with deep insights into decentralized exchange markets. Below are the key features that make our platform unique.
Pool Rank
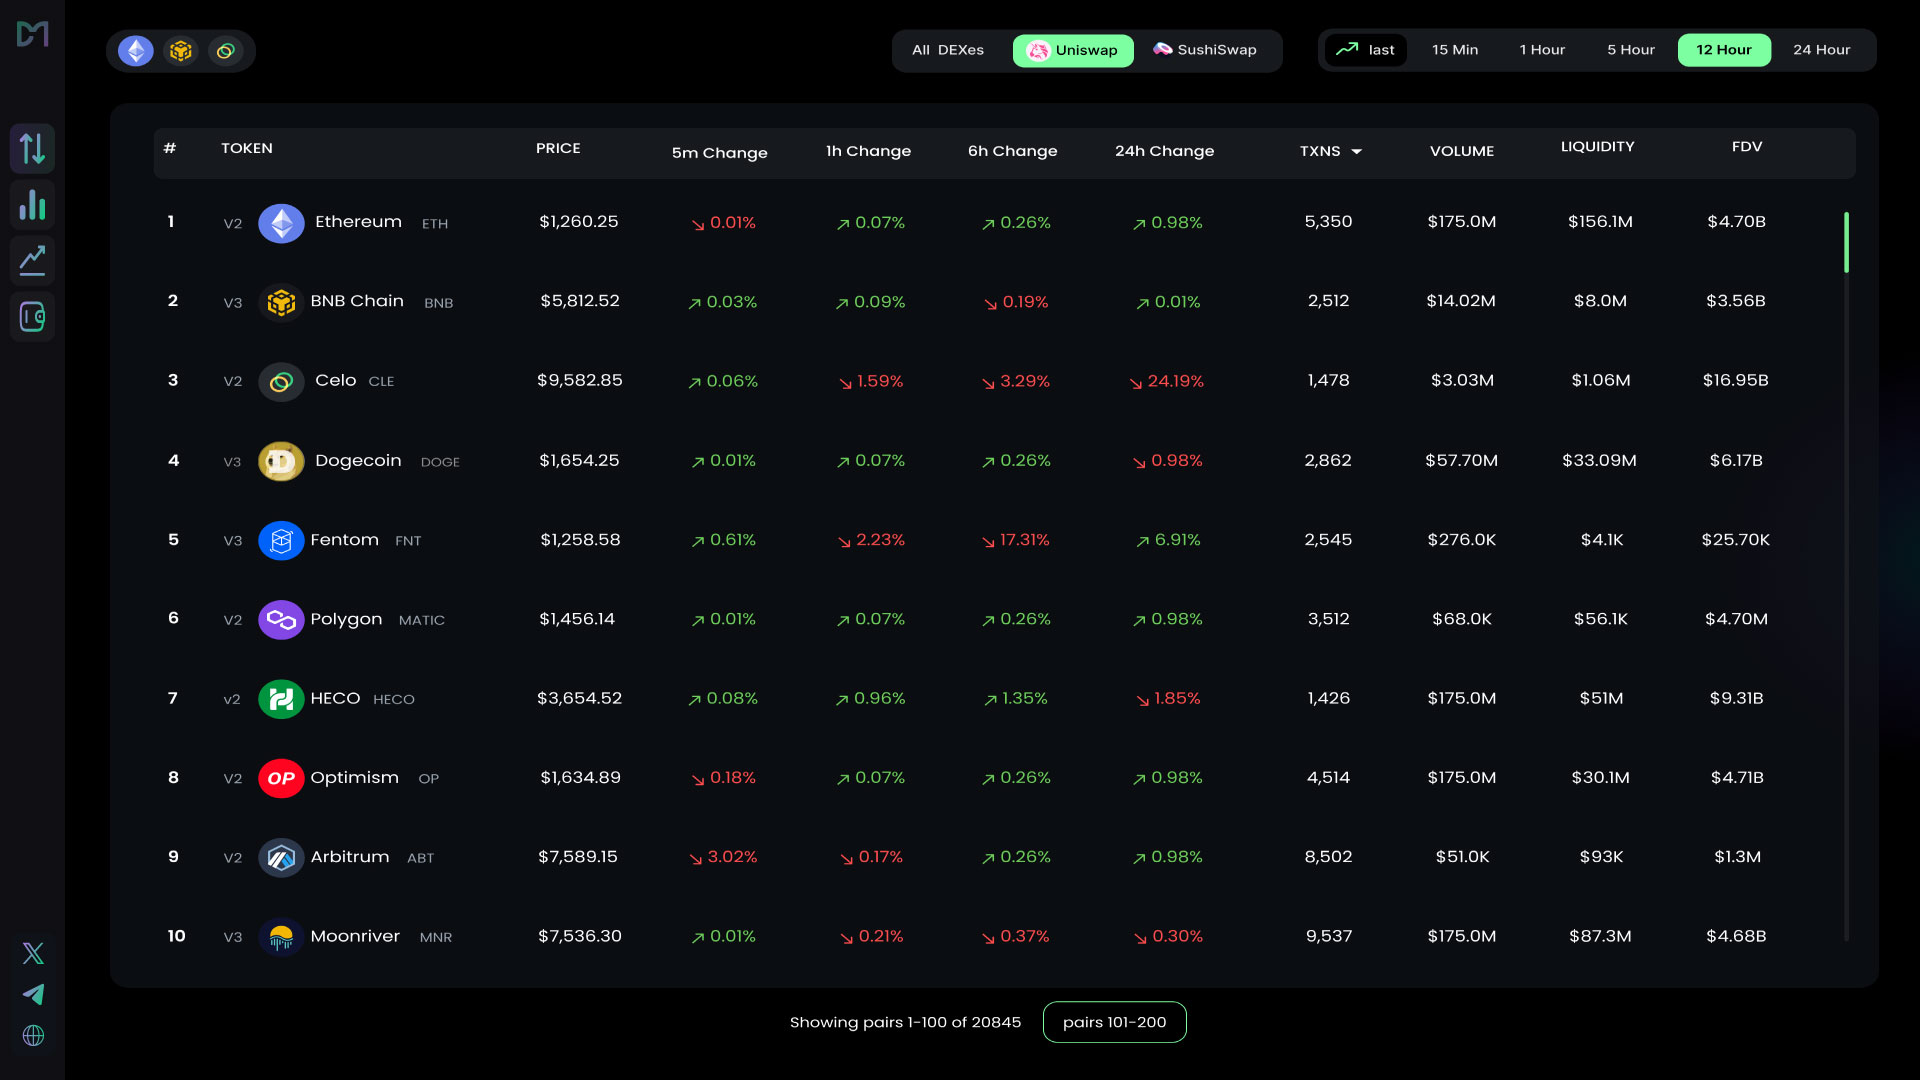
DEX pools are ranked based on swap count by default, with extensive filtering options to help you find the most active and liquid pools in the market.
Filtering Options:
- Name
- Price
- Percentage change (5m, 1h, 6h, 24h)
- Maker count (unique wallets that swapped)
- Volume
- Liquidity
- Fully Diluted Value (FDV)
Ranking Criteria:
- Only pools with at least one swap in the past 24 hours are ranked
- Pools with liquidity below $1,000 are excluded
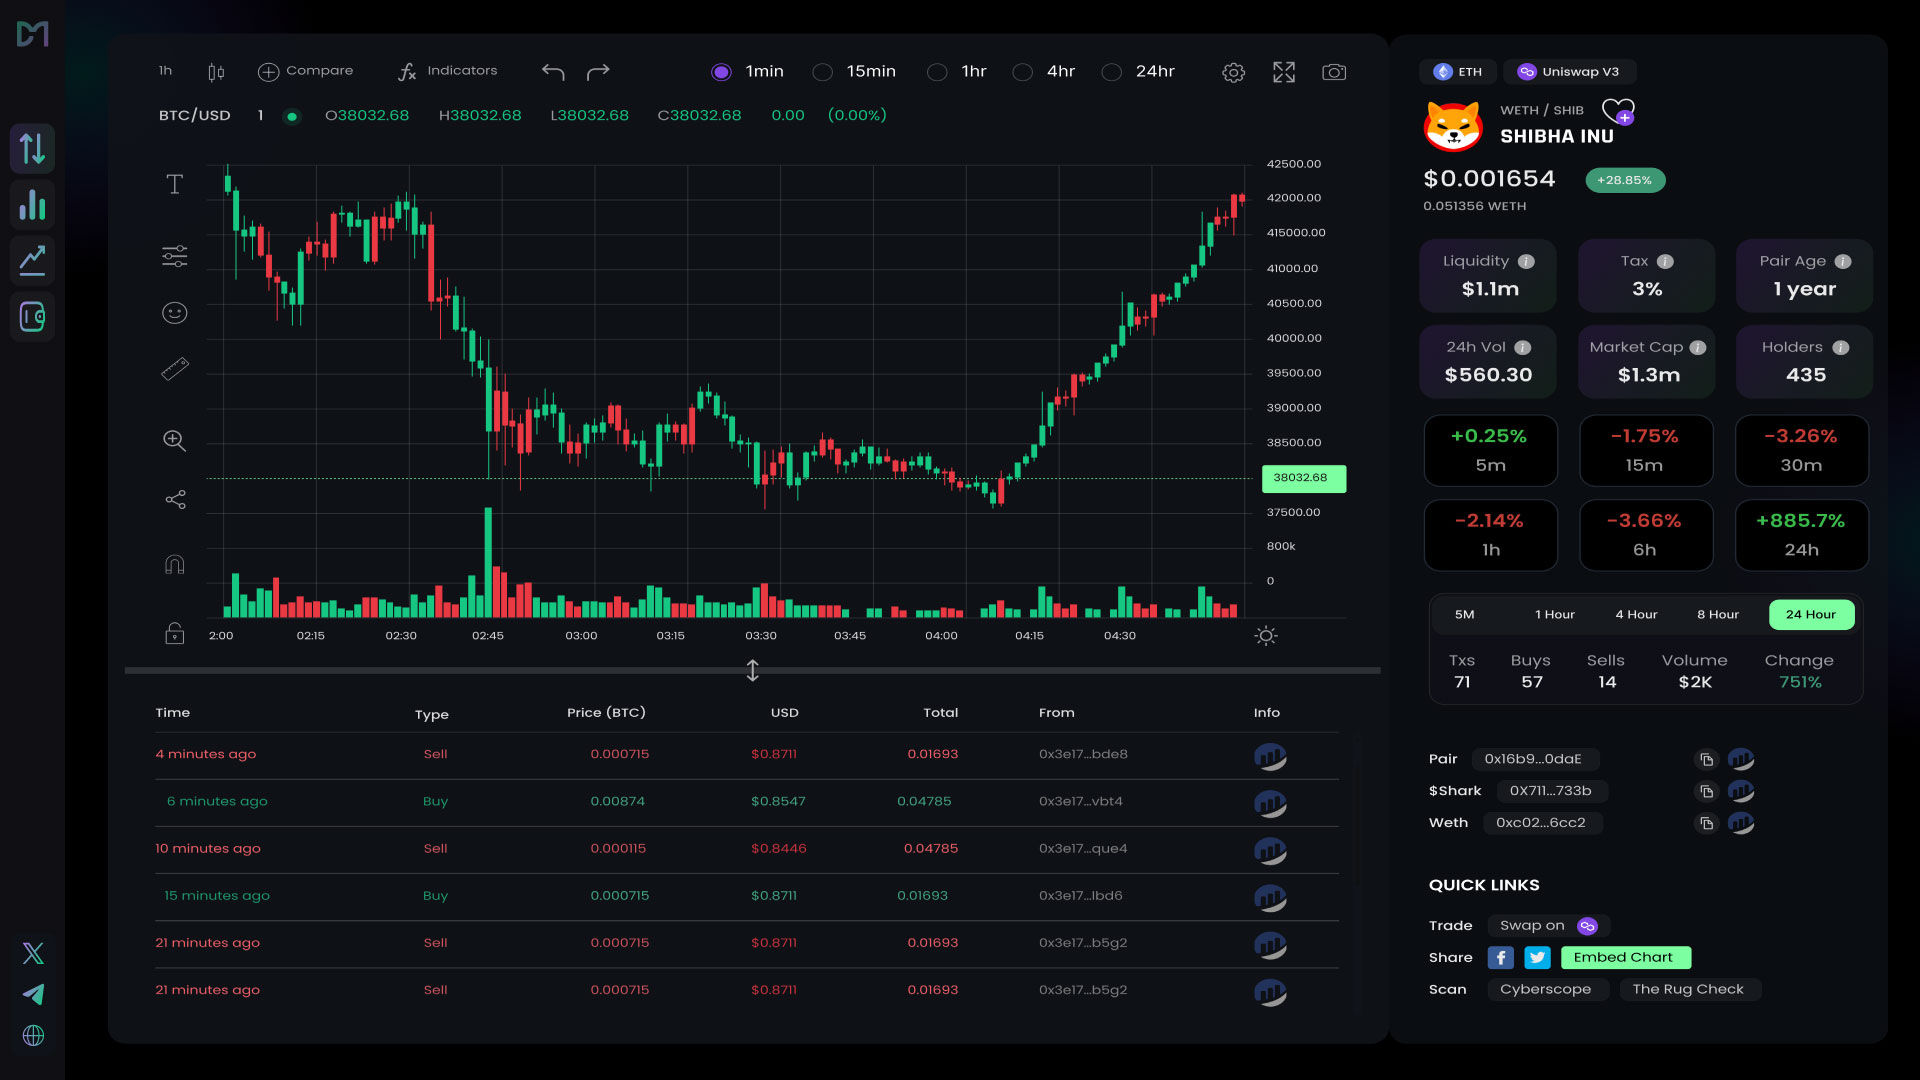
Pool Analytics
Get real-time insights into liquidity pools, including market changes, trading volume, and price trends.
Market Overview:
- Current Price: $1.09
- 24h Price Change: +3.2%
- Trading Volume (24h): $7,100,000
- Liquidity: $15,500,000
- Fully Diluted Value (FDV): $100,000,000
Key Metrics:
- Unique Traders (24h): 1,250
- Number of Swaps (24h): 3,450
- Top Trading Pair: DMC/USDT
Wallet Tracking
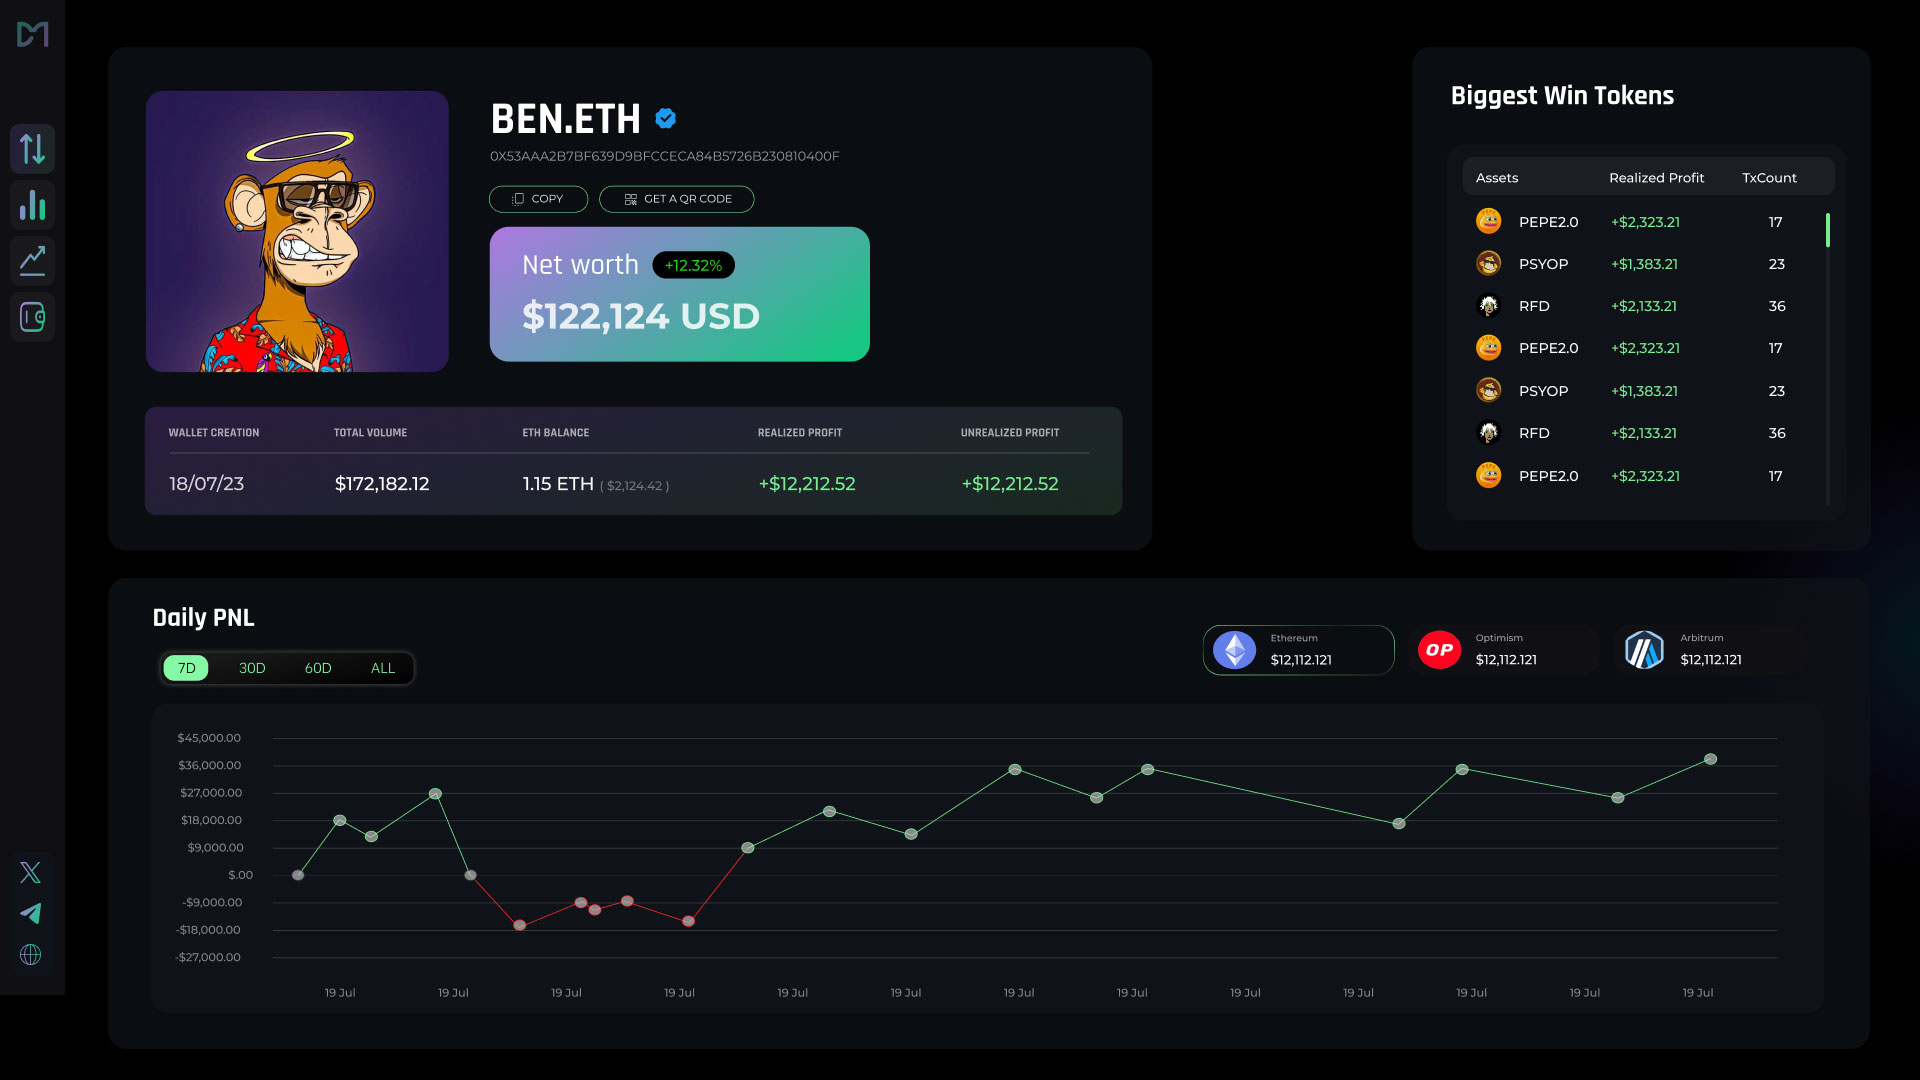
Our wallet tracking dashboard provides a comprehensive view of any wallet's activity and holdings, allowing you to monitor your own portfolio or track other traders.
Dashboard Features:
- Historical swaps and transactions
- Current token and NFT holdings
- Profit and Loss (PnL) calculations
- ENS name and avatar support (auto-generated if unavailable)
This feature gives users a complete view of their own or any tracked wallet, making it easy to analyze trading patterns and performance.
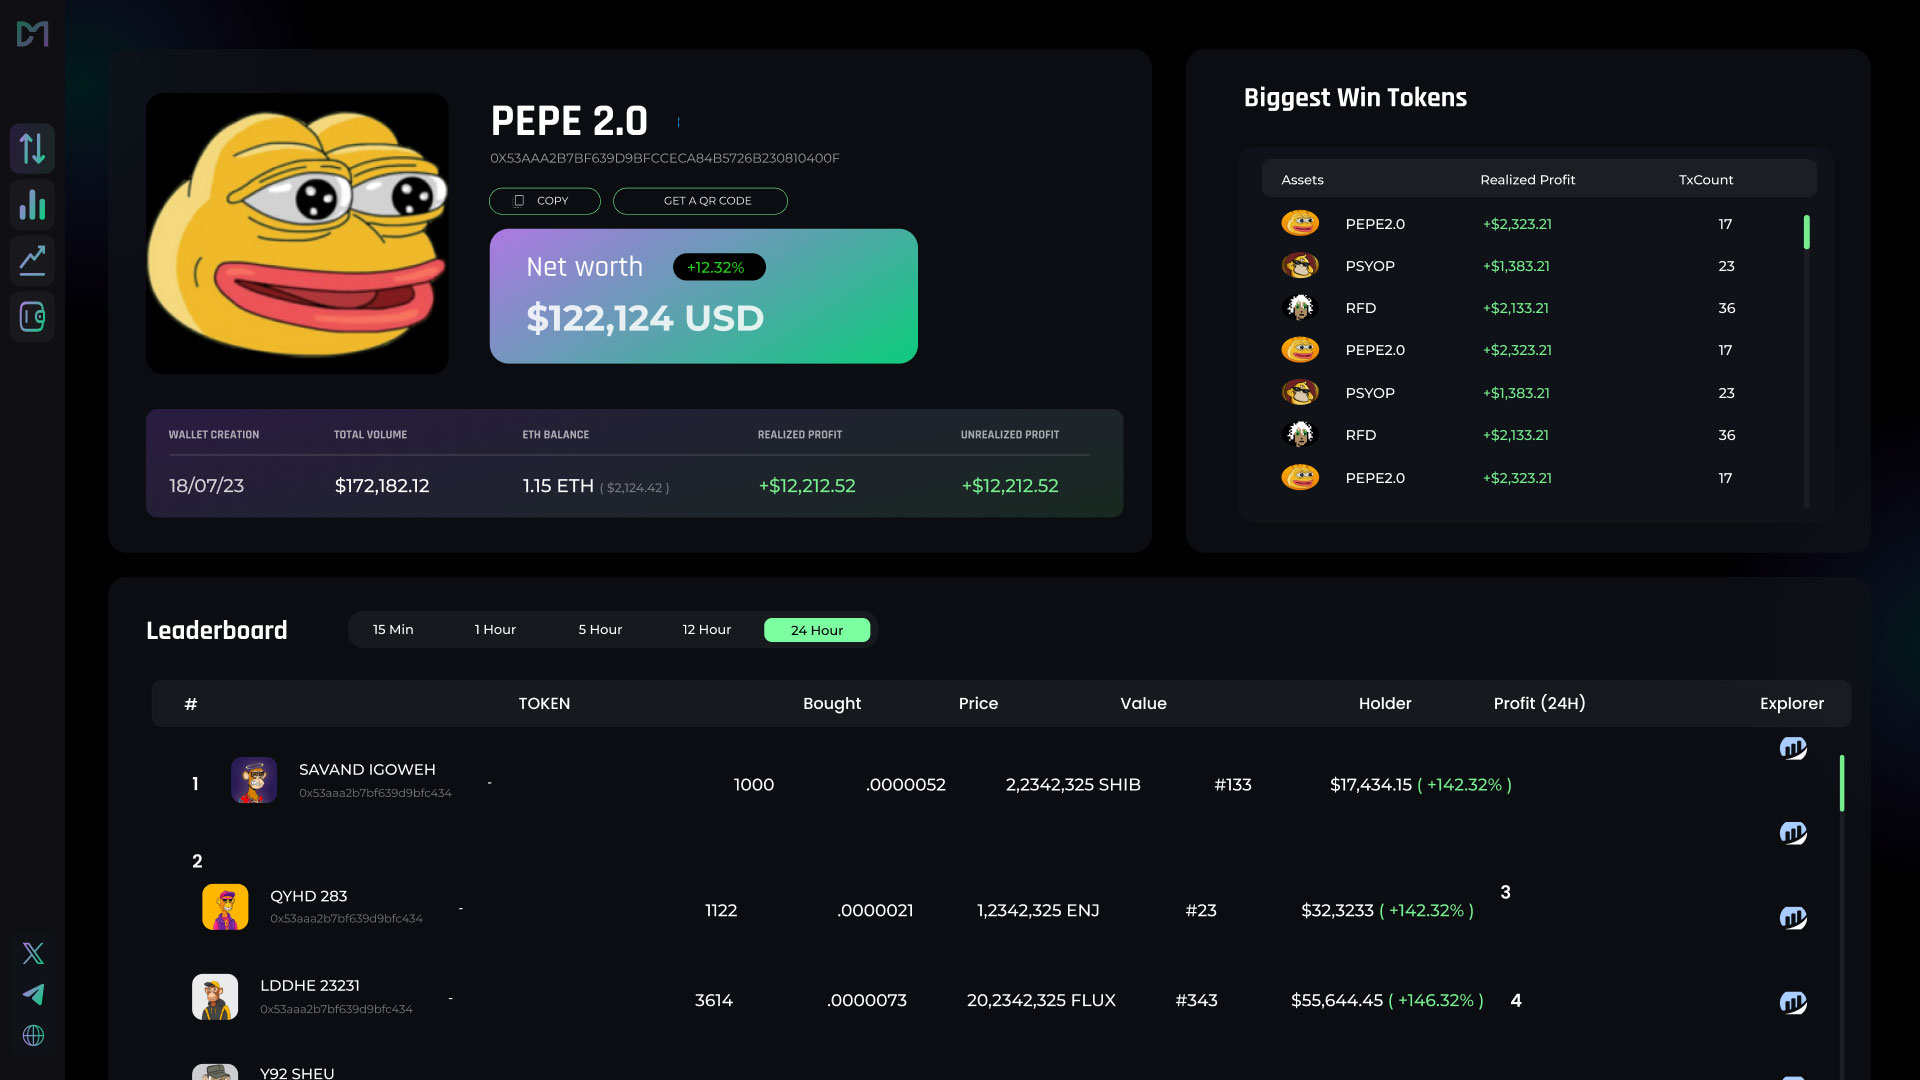
PnL Wallet Rank
Our PnL Wallet Rank feature ranks wallets per token/pool, from best to worst PnL, allowing you to identify the most successful traders for any given asset.
Ranking Based On:
- Realized and unrealized profits
- Performance comparison among top traders
This feature provides an easy way to identify the most profitable wallets for any given token/pool, helping you learn from successful trading strategies.
Bubble Chart
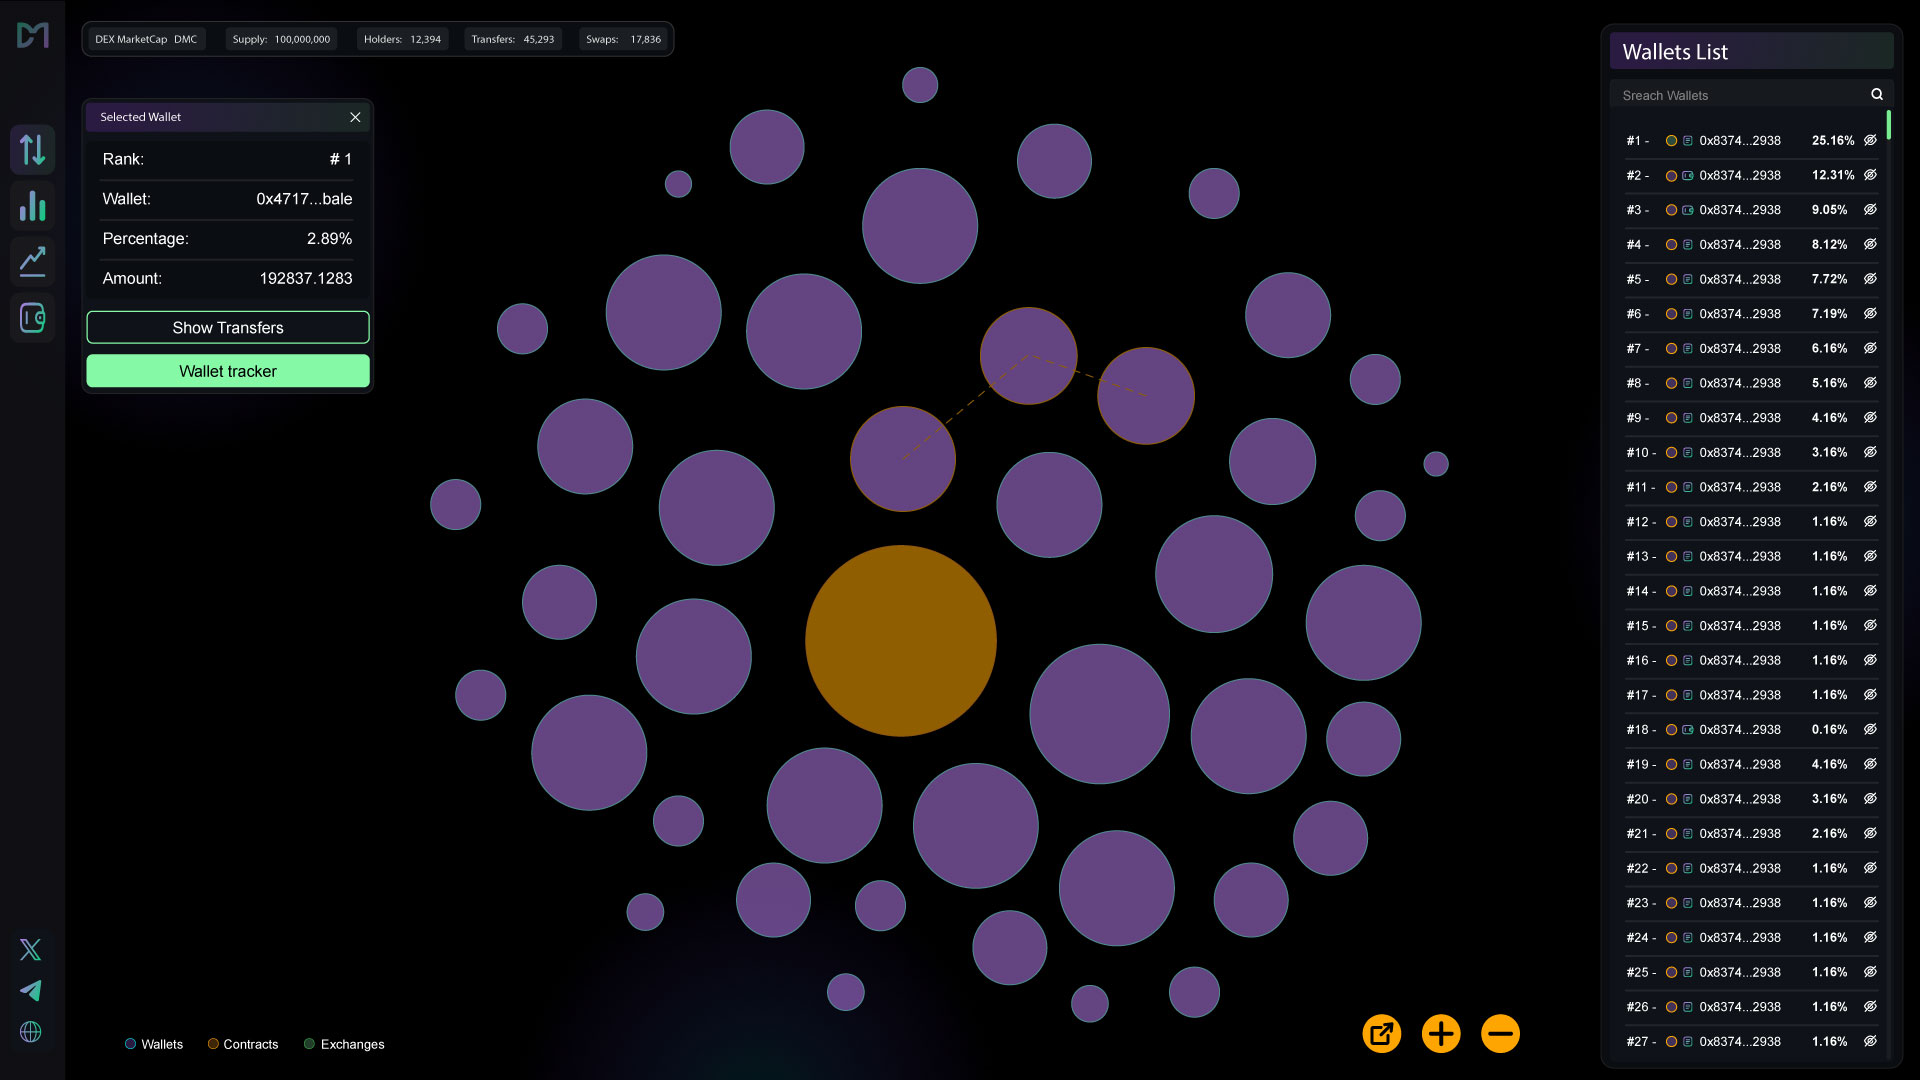
Our Bubble Chart provides a graphical representation of wallet connections for a token, allowing you to visualize the network of holders and their interactions.
Chart Displays:
- Wallet interconnections and shared holdings
- Amount, value, time, and interaction count per wallet
- Rich list rankings for each token
This visual tool helps you track wallet movements and large holders of a token, providing insights into potential market movements.
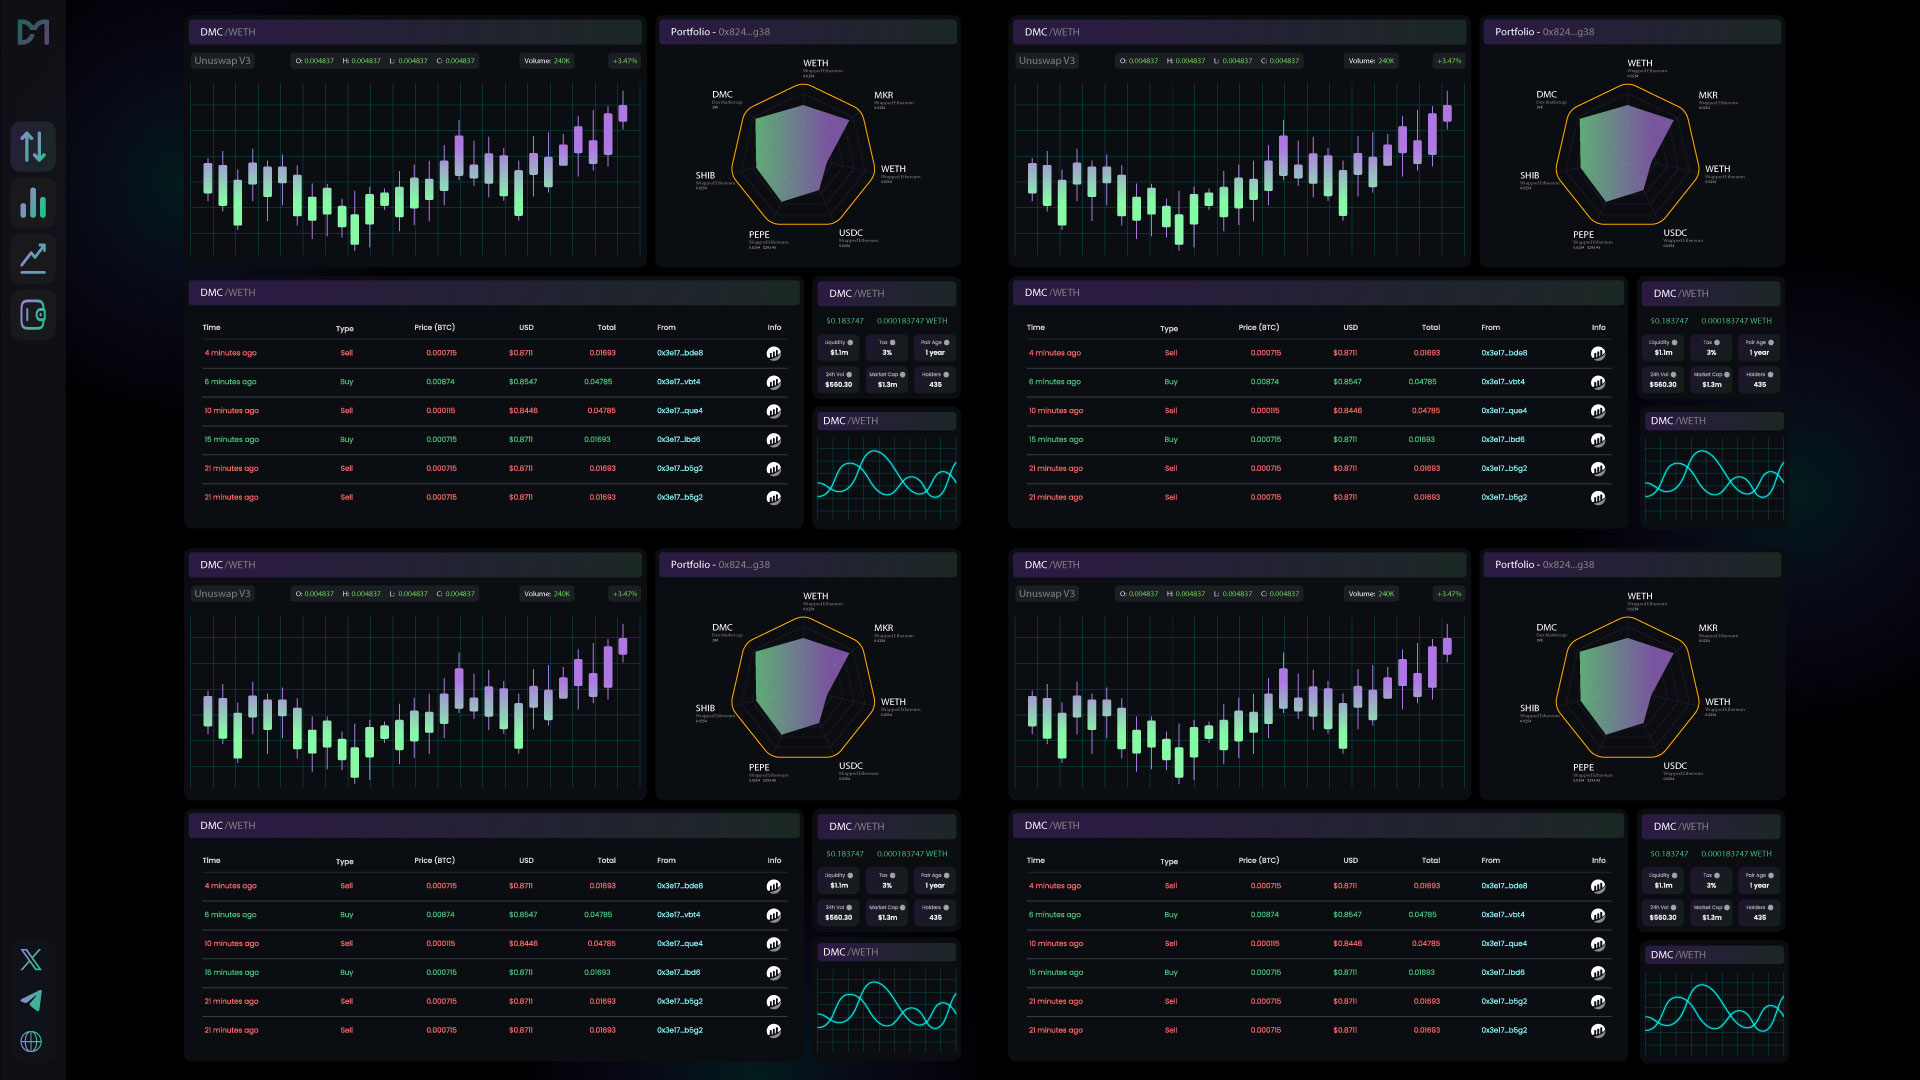
DIY UI (Custom Analytics Interface)
Unlike traditional DEX analytics, which limit users to a single pool/token view, DMC offers a fully customizable analytics dashboard experience.
Key Capabilities:
- Grid-based drag & drop system
- Fully customizable analytics dashboards
- Track multiple tokens/pools in one view
- Components can be embedded as an iframe into other websites
This feature empowers traders with a personalized analytics experience tailored to their strategy, allowing for more efficient market analysis.
API Provider
DMC provides a comprehensive API for accessing real-time and historical data on tokens, pools, and wallets. This allows developers to integrate our analytics into their own applications.
Available Endpoints:
Token Data
Fetch price, liquidity, volume, and FDV for any token.
Pool Data
Retrieve swap counts, top makers, and liquidity metrics.
Wallet Data
Get portfolio holdings, historical transactions, and PnL tracking.
Charting Data
Access real-time and historical charts for tokens and pools.
Usage:
- Developers can integrate DMC's API into trading bots, portfolio trackers, and analytics tools
- Real-time data ensures accurate and up-to-date market insights
Our API enables seamless integration of DEX analytics into third-party applications, providing traders with reliable market data for informed decision-making.
Previous
HomeNext
Token Economics